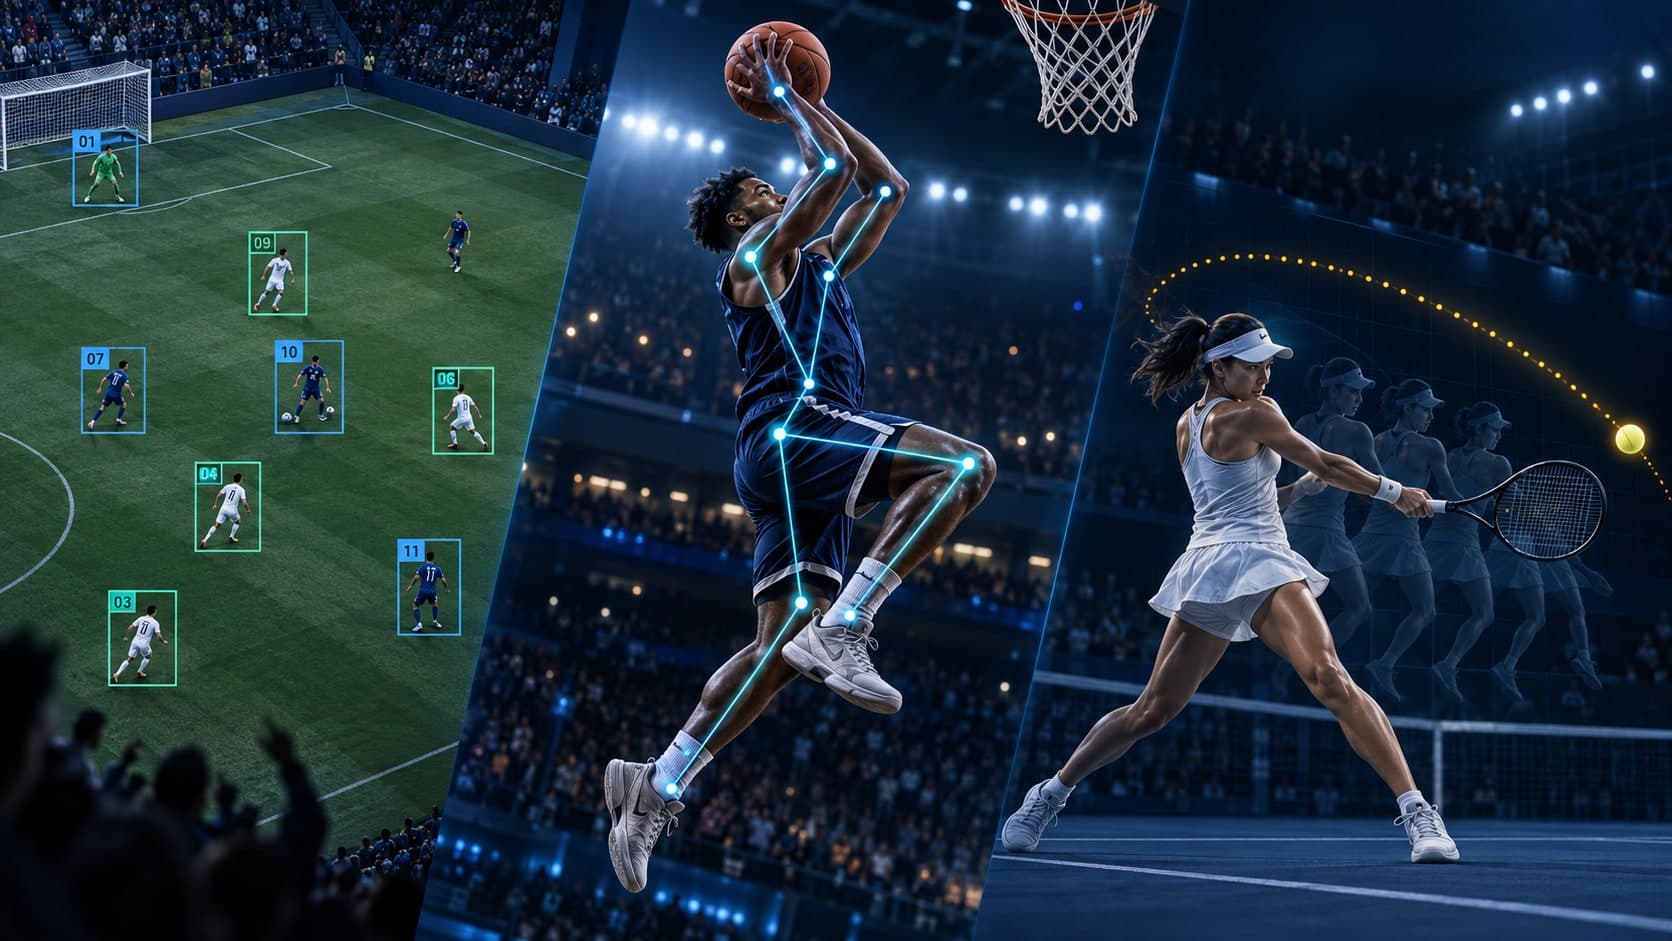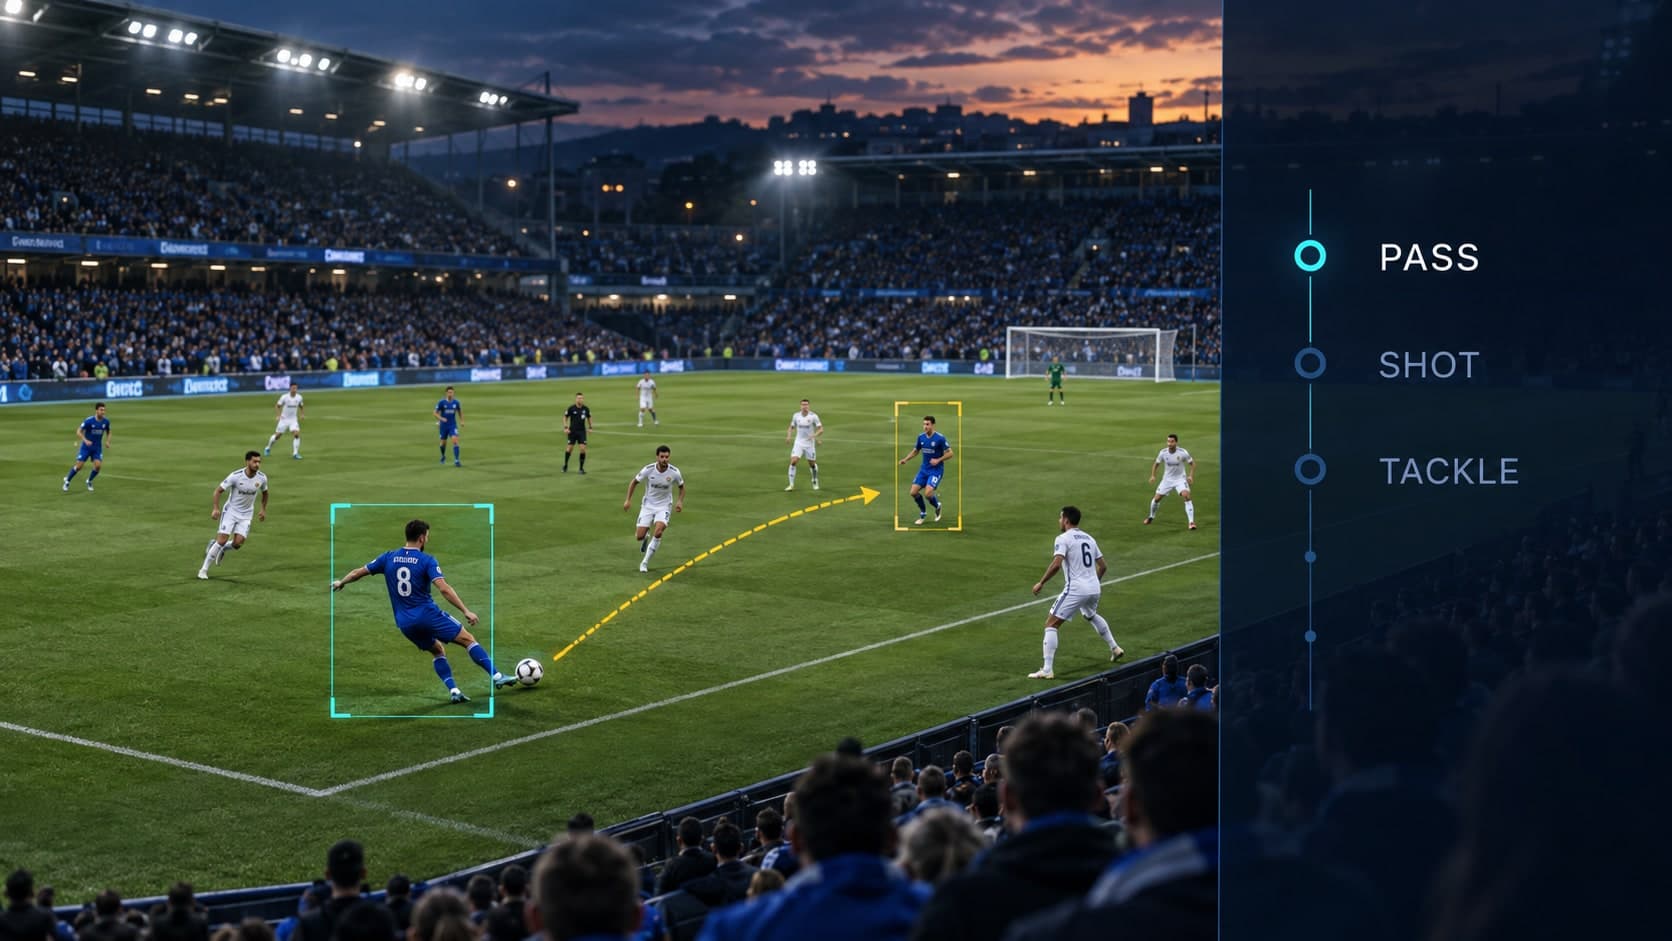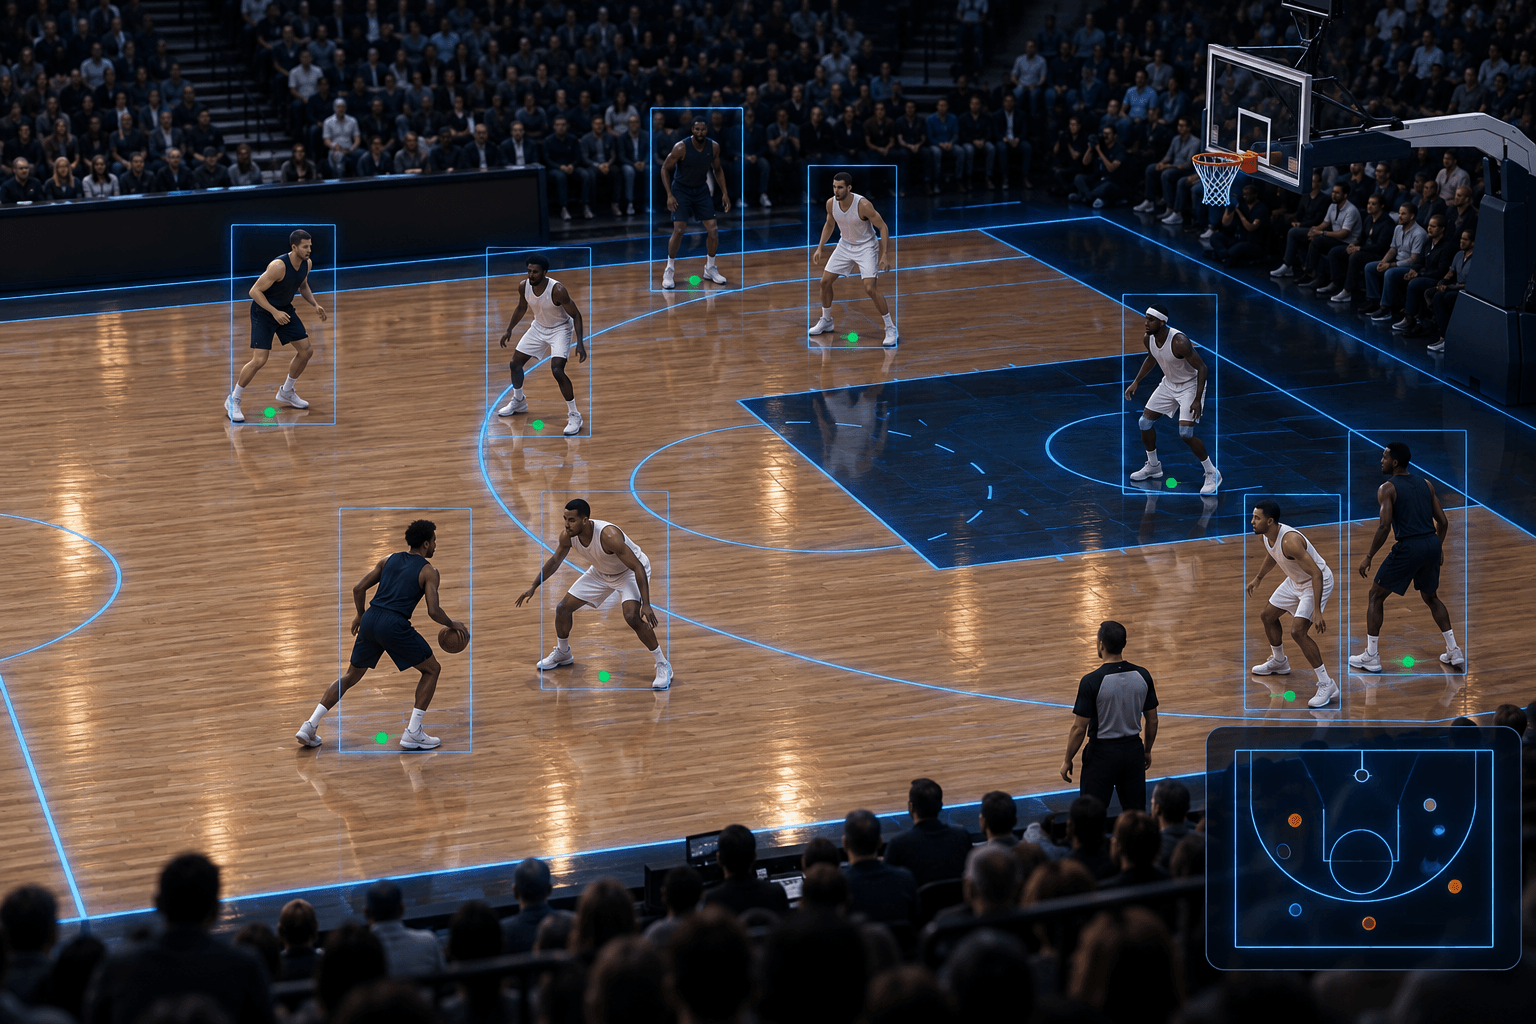
Broadcast player tracking turns ordinary TV footage into a record of where every player stood and who they were, frame by frame. It takes four stages: court registration to convert pixels into court coordinates, detecting and tracking players within a shot, re-identification to keep identities across camera cuts, and jersey number recognition to attach a name to each track.
A player detector gets you boxes measured in pixels. Speed, distance covered, spacing and defensive assignments are measured in real-world units and belong to named players. Everything between those two points is where broadcast tracking projects succeed or stall, and each stage fails in its own way.
This guide walks through the four stages using football (soccer) benchmarks with basketball and American football examples. It shows how researchers score the whole chain at once and sets out the training data each stage needs.
Key Takeaways
- Boxes in pixels are not player data. Court position and player identity are separate problems, and either one can sink the pipeline.
- On the SoccerNet Game State Reconstruction benchmark, the public baseline scored 23.36 GS-HOTA on the challenge set. Its authors single out camera calibration, pitch localisation and jersey number recognition as its weak modules.
- On the same challenge set, the 2024 winner reached 63.81 and credited its pitch localisation for more precise player positioning.
- Generic person re-ID struggles in team sports because teammates dress alike. Sports re-ID models learn team and role alongside identity.
- The broadcast benchmarks covered here score 30-second clips, single actions or 20-frame sequences, so their leaderboards do not measure identity across a full game.
What does it take to turn broadcast video into player positions?
You need two answers for every player in every frame: where they are on the court and who they are. Court registration answers "where". Detection, tracking, re-identification and jersey number recognition together answer "who". The two branches run side by side and merge into what researchers call the game state.
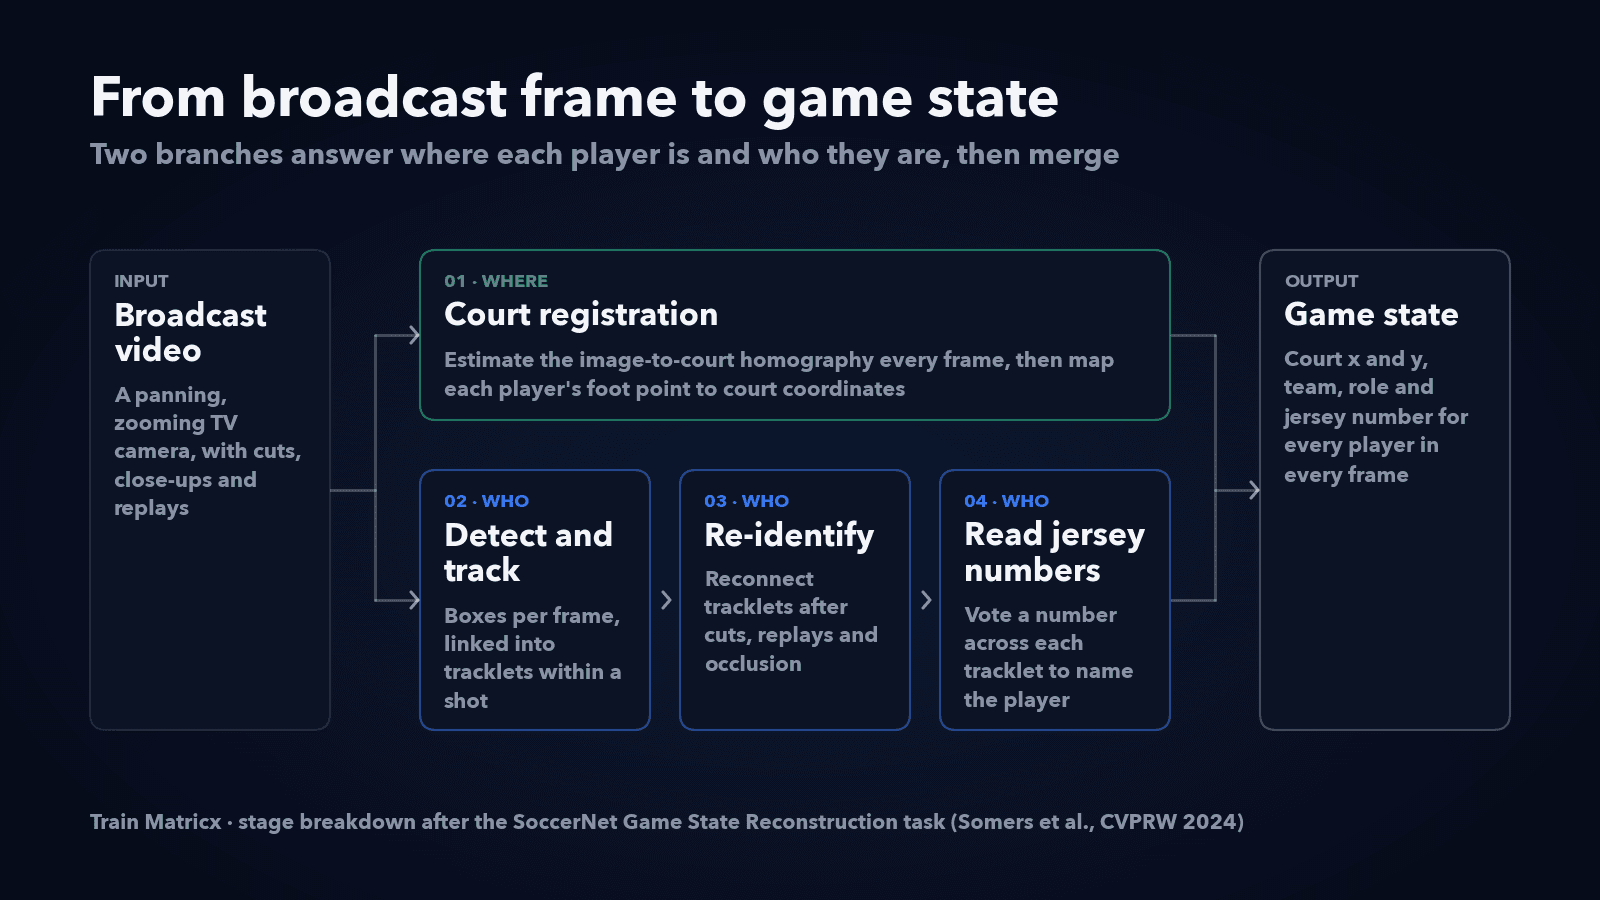
The clearest public definition of that output comes from football. SoccerNet's Game State Reconstruction (GSR) task asks a system to locate and identify every player in broadcast video and place them on a top-down map of the pitch (SoccerNet 2025 Challenges Results). The GSR dataset contains 200 video sequences of 30 seconds. They are annotated with 9.37 million line points for pitch localisation and camera calibration, and more than 2.36 million athlete positions labelled with role, team and jersey number (Somers et al., CVPRW 2024).
GSR is a football benchmark, but the stages are the same in basketball and American football. The sport changes which stage hurts most.
Step 1: Court registration maps pixels to court coordinates
Court registration estimates the transformation between the camera image and a flat court template, usually a homography. Once it is known, any point on the floor in the image converts to a real-world position on the court.
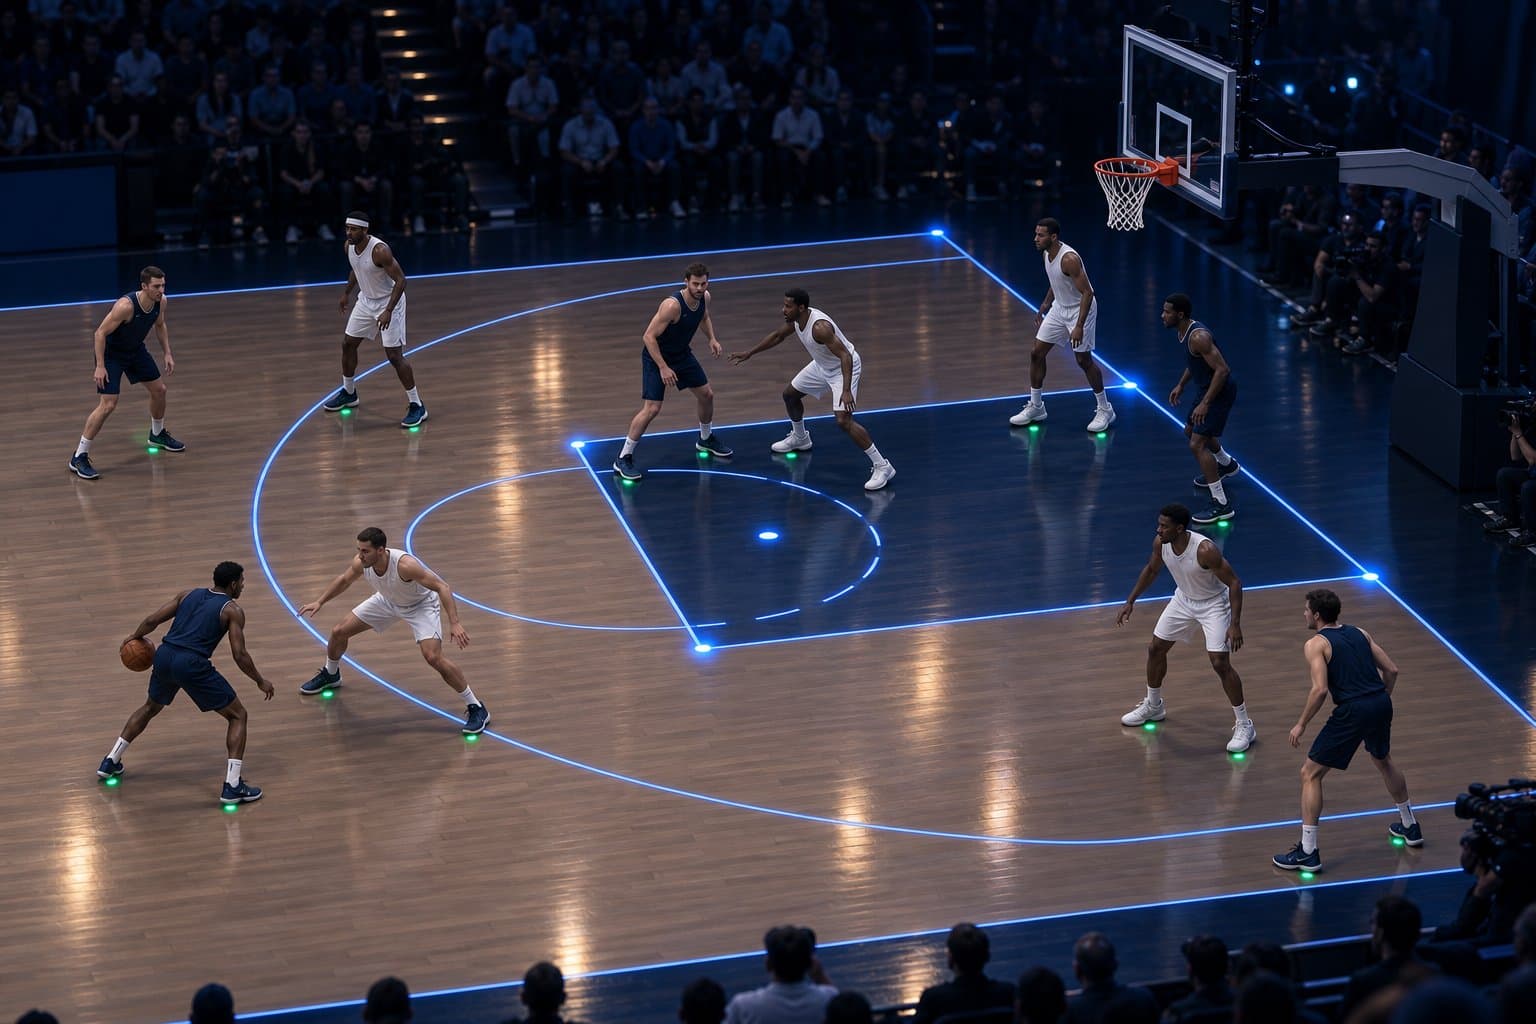 Illustration: fixed court landmarks, such as lane corners and the ends of the three-point line, are the points registration matches to the court template.
A homography is a 3×3 matrix that maps one plane onto another. To solve for it, you need at least four points whose positions you know in both the image and the court diagram, with no three of them in a straight line. Good candidates are lane corners, the ends of the three-point line and the points where the centre circle meets the half-court line.
Three details decide whether that works on broadcast footage.
The mapping changes every frame. A broadcast camera pans, tilts and zooms to follow play, so registration is estimated per frame, not once per game.
Only points on the floor map correctly. A homography assumes a flat plane. A player's feet touch the court; their head and a ball in flight do not. So a pipeline should map the bottom centre of each player box. Ball height needs more: full camera calibration plus another cue, such as a second view, the ball's apparent size or a trajectory model. TVCalib (WACV 2023) takes the calibration route, treating field registration as camera calibration and recovering camera pose and focal length rather than a planar mapping alone.
The court template must match the league. The NBA three-point arc sits 23 ft 9 in from the middle of the basket (NBA Rule No. 1). The NCAA's 2025-26 court for men and women puts it at 22 ft 1¾ in (NCAA court diagram). Register a college game against an NBA template and the top of the arc sits about 1 ft 7 in closer to the basket than the template expects, which skews the whole mapping, not just the arc.
Methods differ mainly in what they detect. KaliCalib, evaluated on the MMSports 2022 basketball camera calibration challenge, predicts court keypoints with an encoder-decoder network and cut mean squared error by a factor of 4.7 compared with the challenge baseline (Maglo et al., 2022). PnLCalib (2024) estimates calibration from keypoints on a 3D pitch model, then refines it using detected field lines. In principle, lines give the solver more to work with when only part of the playing surface is in view.
Officiating systems take a different route: semi-automated offside uses multiple fixed cameras calibrated before the match and triangulates positions in 3D, as covered in our breakdown of semi-automated offside technology.
Step 2: Tracking links detections within a shot
A detector finds players in each frame and a tracker links those detections into tracklets, short runs of the same player across consecutive frames. The GSR baseline pairs a YOLOv8 detector with the StrongSORT tracker (Somers et al., CVPRW 2024).
A tracker holds identity only while conditions stay friendly. When two players overlap, it must guess which box is which as they separate. In basketball that happens on every screen, which is why identity through screens is one of the hardest parts of NBA tracking. In American football the problem peaks at the snap, when the lines collide.
A camera cut breaks the motion cues a tracker relies on. Some trackers, StrongSORT included, also compare appearance, but that matching is tuned for short gaps within a shot, not a new shot from a different angle. Linking identities across shots is re-identification's job.
Step 3: Re-identification keeps identity across cuts and occlusion
Player re-identification (re-ID) decides whether a player seen now is the same player seen earlier, after a camera cut, the end of a replay or a long occlusion. It compares appearance features learned by a neural network rather than relying on position.
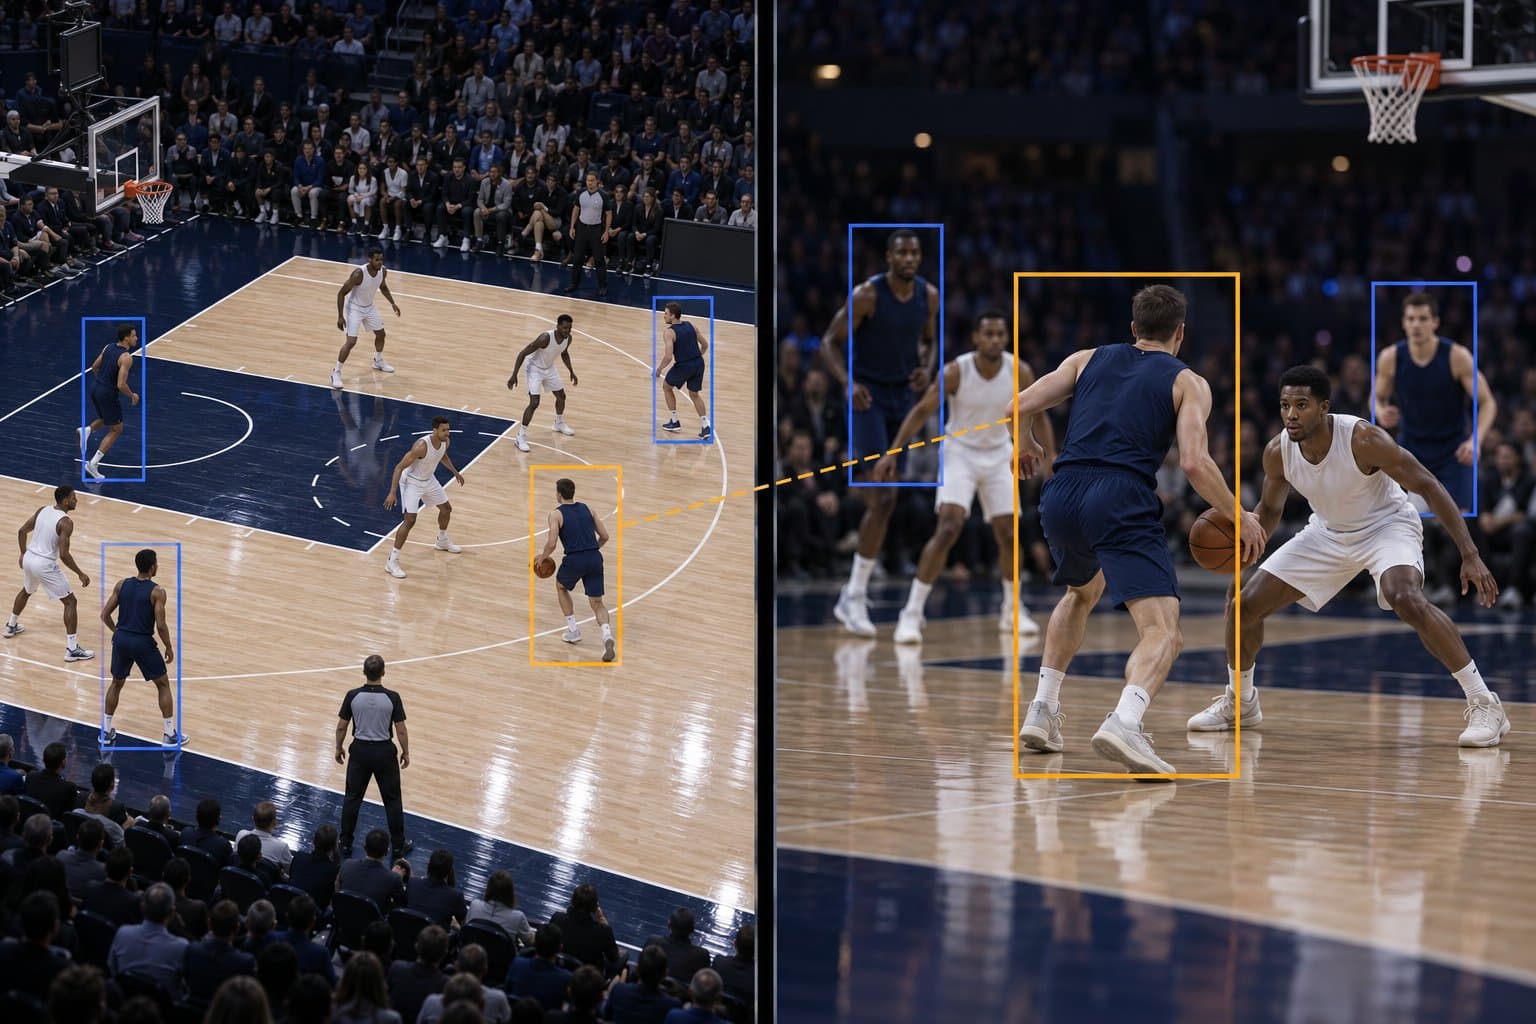 Illustration: re-ID has to match a player across camera angles when teammates wear identical kit.
Telling people apart by appearance is much harder when their clothing matches, and team sport guarantees that it does. Players on the same team wear near-identical kit, each identity has few training samples, image resolution is low and variable, occlusion is heavy and movement is fast (Comandur, 2022).
Sports-specific models respond by learning more than identity. PRTreID trains one network to perform re-identification, team affiliation and role classification together, citing non-linear player motion, same-team appearance and frequent occlusion as the reasons generic re-ID falls short (Mansourian et al., MMSports 2023). It is the re-ID module inside the GSR baseline.
Two public benchmarks show how the task is measured:
- SoccerNet ReID holds 340,993 player crops from broadcast video of 400 games across six leagues. Each query is matched against players from the same action seen from other camera views, and results are reported as mAP and rank-1 accuracy (SoccerNet sn-reid).
- DeepSportradar player re-ID uses 20-frame basketball sequences from a single camera viewpoint, supplied by Synergy Sports. The query is a player in the first frame and the gallery is the rest of the sequence. The organisers' baseline scores about 72.7 mAP on the test set (DeepSportradar challenge).
Read both benchmarks for what they leave out. Each matches players within one action or one short sequence. A real broadcast asks the model to hold identity for a whole game, through substitutions, timeouts and players who leave the screen for minutes. Full-match identity annotation does exist, in SoccerTrack v2's 10 full matches, but they are panoramic 4K recordings, so there are no broadcast cuts to survive.
American football adds another obstacle. Helmets remove the face and head as cues, leaving jersey number, build and position, as covered in our guide to American football computer vision. The NFL's Kaggle competition on helmet assignment supplied Next Gen Stats tracking data alongside video, so entrants could match helmets in the footage to tracked player positions.
Step 4: Jersey number recognition attaches names to tracks
Re-ID tells you two crops show the same person. Jersey number recognition tells you which person. Combine the number with team affiliation and a roster, and a track becomes a named player.
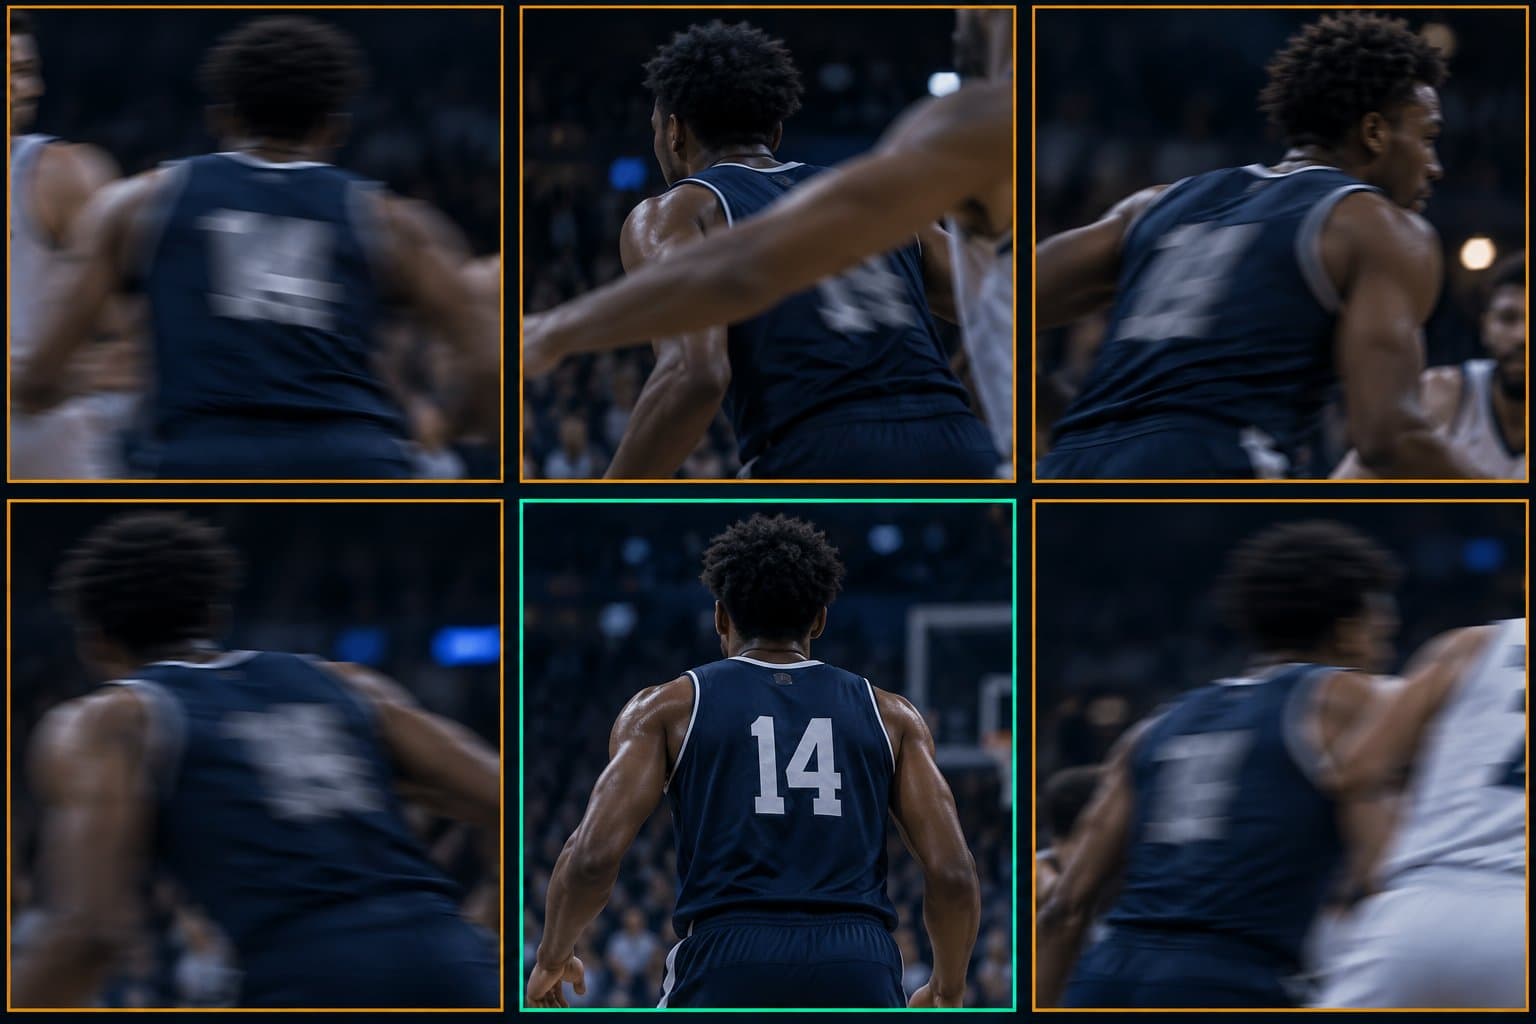 Illustration: in most frames the number is blurred, blocked or turned away, and only some frames give a clean read.
It looks like the easiest stage, yet the GSR authors list it among their baseline's key weaknesses. In broadcast football footage, jersey numbers are "not visible in most of the frames", according to a study of low-resolution SoccerNet video that also lists motion blur, distortion and occlusion (Balaji et al., MMSports 2023). Their approach first identifies the frames where the number is readable, and the authors report accuracy increases of 37.81% and 37.70% on two test sets with domain gaps.
In our view the lesson carries across sports: aggregate readings across the whole tracklet, for example with a confidence-weighted vote, rather than trusting any single frame. That only works if the tracklet is clean, so identity errors from Steps 2 and 3 surface as wrong names here. Team affiliation, the other half of the lookup, is assigned in the GSR baseline by averaging each tracklet's re-ID embeddings and splitting them into two teams with K-means.
How is the whole pipeline measured?
SoccerNet scores the full chain with GS-HOTA, a metric derived from the standard HOTA tracking metric. A prediction only counts if it is close enough on the pitch and every identity attribute is right.
Position similarity is a Gaussian on pitch distance with a 5 metre scale parameter, falling smoothly to 5% at 5 metres rather than cutting off. Identity similarity is 1 only if role, team and jersey number all match and 0 otherwise, so a prediction with any wrong attribute cannot be matched (Somers et al., CVPRW 2024). That strictness is the point. A system with perfect positions and wrong names scores badly, just as it would fail a coaching staff.
The public baseline scored 22.26 GS-HOTA on the test set and 23.36 on the challenge set. The paper's ablation shows where those points go. Each module runs on real predictions together with the modules that depend on it, while everything else is replaced by ground truth.
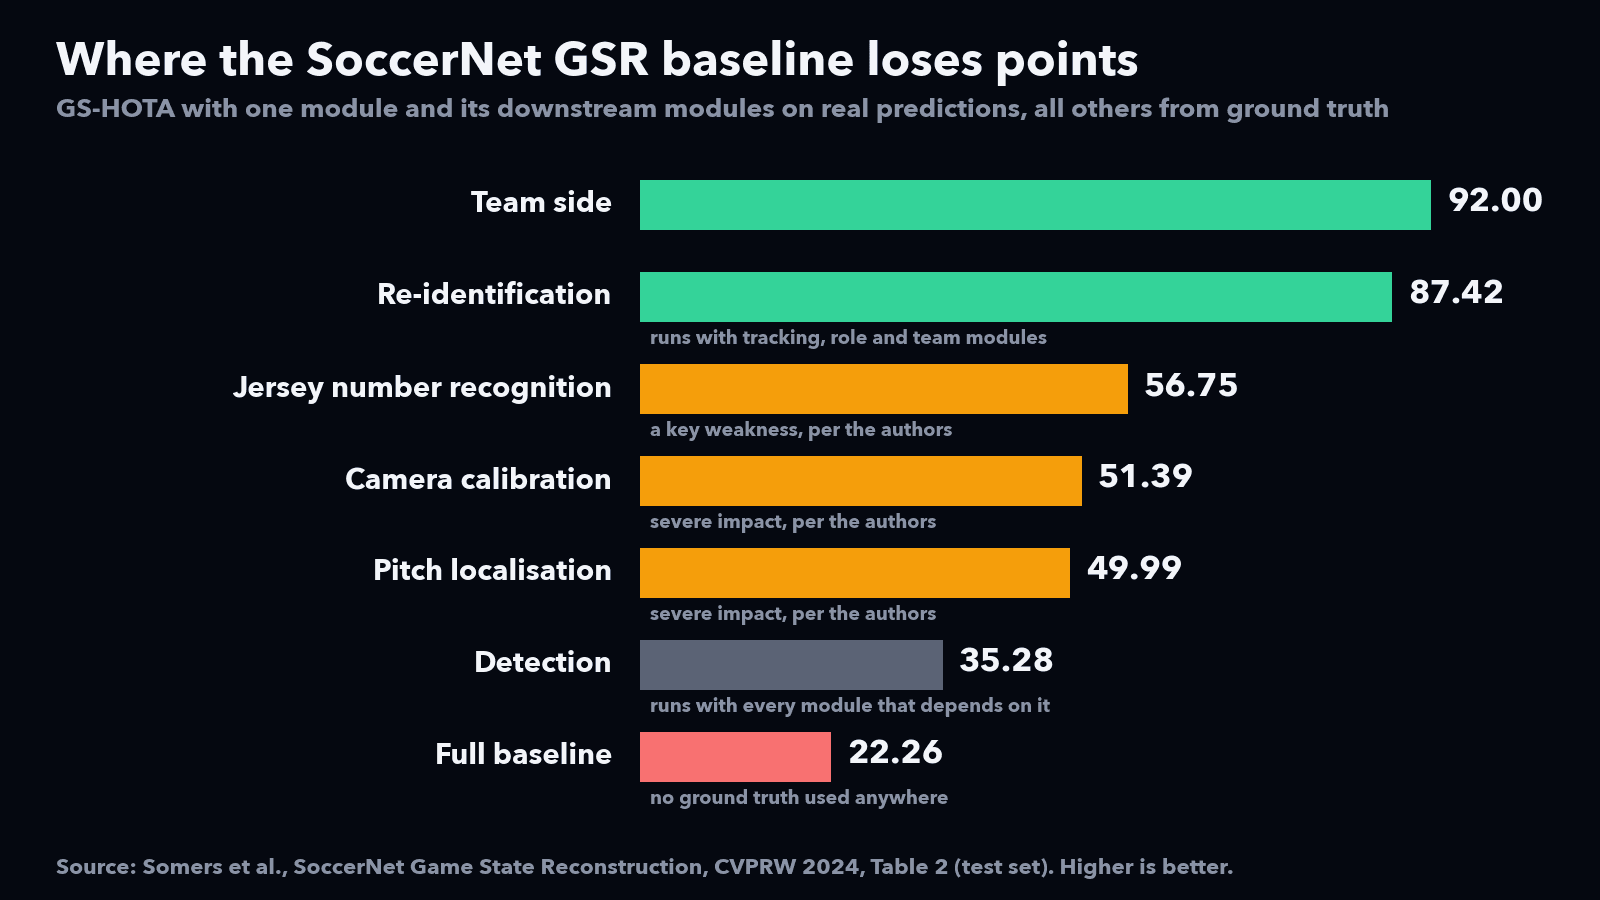
Team side, which compares the teams' average positions to decide who is on the left of the pitch and who is on the right, costs least at 92.00. Re-ID, running with tracking, role classification and team clustering, holds up at 87.42 inside 30-second clips. Running calibration, pitch localisation or jersey number recognition for real drops the score to between 49.99 and 56.75: the authors describe calibration and pitch localisation as having a severe impact, and jersey number recognition as another key weakness. Detection scores lowest at 35.28, most likely because that row runs almost the whole pipeline on real predictions.
The 2024 GSR challenge shows how much room the baseline left. The winner scored 63.81 GS-HOTA on the challenge set, against 43.15 for second place and 23.36 for the baseline (Golovkin et al., 2025). Its GS-DetA, the detection accuracy component, was 49.52, and its GS-AssA, the association component, was 82.23. The authors credit their pitch localisation pipeline for positioning and their post-processing for cleaner tracklets. Our reading of those two numbers: even the winning system finds it harder to get each detection right, in position and attributes, than to keep tracks linked over time.
What training data does each stage need?
Each stage needs a different kind of label. The hardest to produce are the labels that make a pipeline work outside a benchmark: identity held across cuts, and numbers attached to whole tracklets.
| Stage | What gets labelled | What makes it hard | Public starting point |
|---|---|---|---|
| Court registration | Court keypoints or line segments per frame | Tight shots with few visible landmarks, arena logos, league-specific templates | SoccerNet GSR line points; DeepSportradar calibration views |
| Detection and tracking | A box and a track ID per player per frame | Overlaps on screens, piles and set pieces | SportsMOT; TrackID3x3 |
| Re-identification | Identity links across cuts, replays and off-screen gaps | Teammates in identical kit, long gaps between appearances | SoccerNet ReID; DeepSportradar re-ID |
| Jersey numbers | A number per tracklet, with readability | Numbers unreadable in most frames | SoccerNet GSR attributes |
| Team and role | Team, and player, goalkeeper or referee | Alternate kits, officials in similar colours | SoccerNet GSR attributes |
Check the licence before any of these datasets goes near a commercial model. SoccerNet video sits under an NDA, and DeepSportradar's re-ID repository states no data licence while crediting Synergy Sports for the footage. Our guide to public sports computer vision datasets compares licences dataset by dataset.
Where you need custom labels, two decisions matter more than volume. Choose the label geometry deliberately, because bounding boxes and skeletal keypoints support different downstream uses. Write the identity rules down before labeling starts, using our player re-ID labeling spec. Then audit identity across time, not frame by frame: an ID-persistence audit catches the switches a spot check misses, as covered in how to measure annotation quality. The full process is in our guide to building a sports computer vision training dataset.
Where does broadcast tracking break in production?
Several failure modes sit at the boundaries these broadcast benchmarks leave out: replays, close-ups, other leagues and full-game timelines.
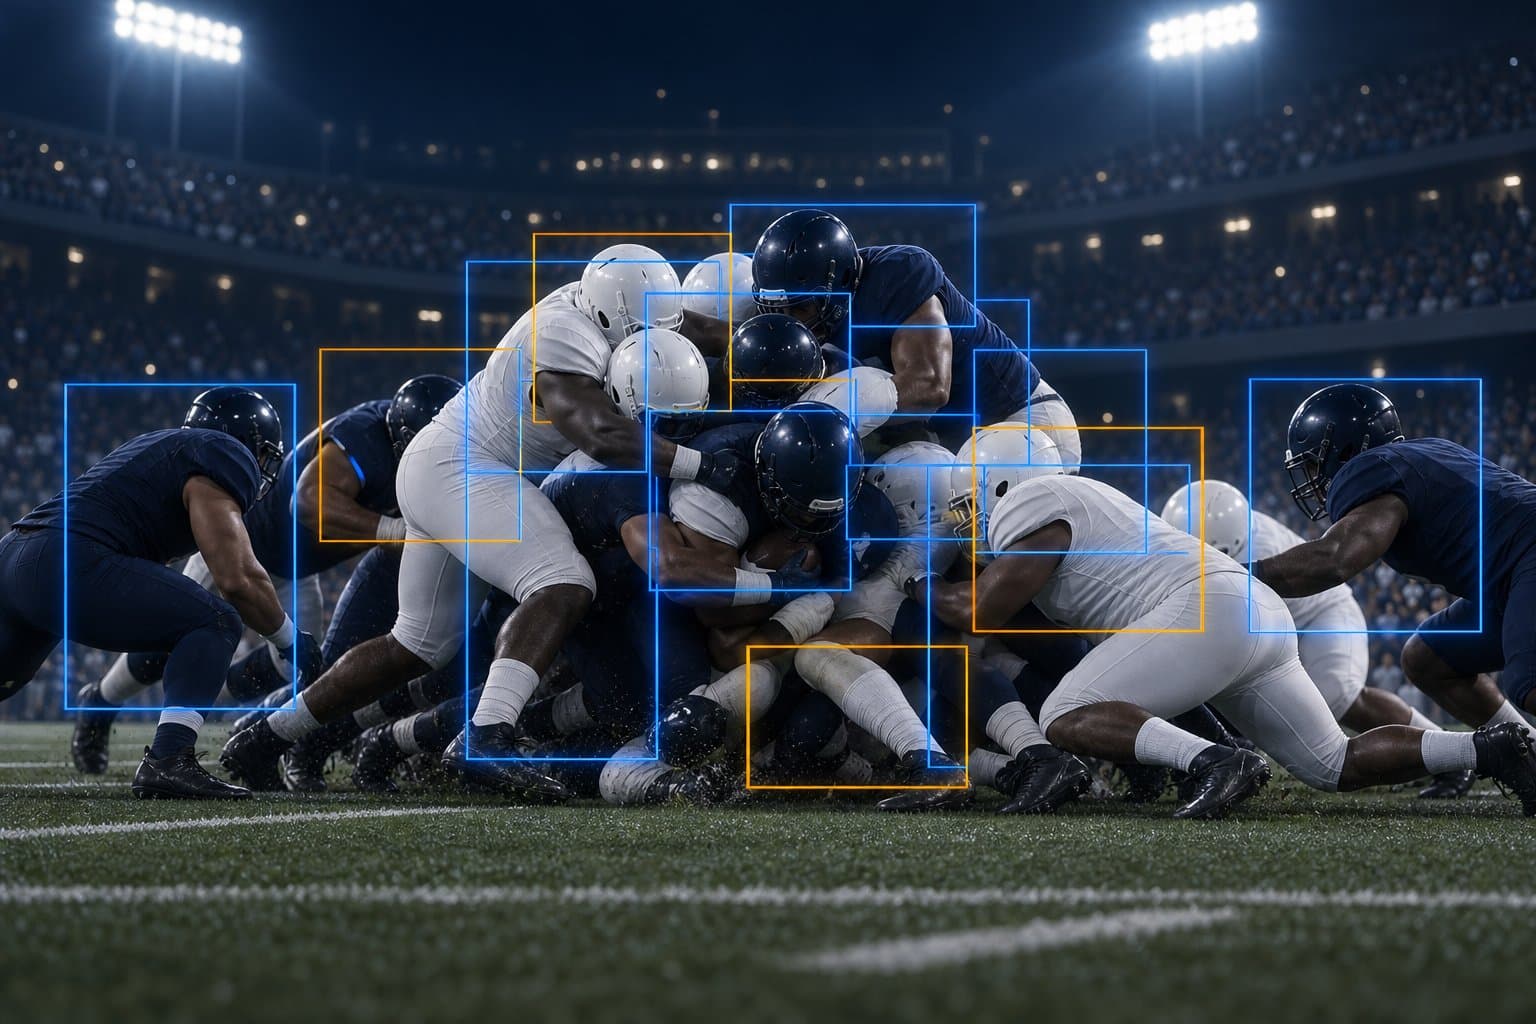 Illustration: in a pile, boxes overlap and numbers are hidden, so identity stays uncertain (amber) until players separate.
- Replays. A replay shows play that already happened, often from another angle. A pipeline that treats it as live footage writes duplicate positions into the game state, so the pipeline needs to detect shots and replays before tracking.
- Close-ups. Tight shots may show too few court markings to register. The honest output for those frames is "no position", not a guess.
- League and arena changes. A keypoint model trained on NBA courts meets a shorter three-point arc in college games, plus painted logos and floor graphics that vary by arena.
- Piles and helmets. In American football, players on the ground may show no readable number and no distinguishing features until the pile clears.
- Full games. Benchmark clips of 30 seconds hide how identity errors accumulate over 40, 48 or 60 minutes. One uncorrected switch early in a game corrupts both players' statistics from that point on.
Frequently asked questions
What is court registration in sports computer vision?
Court registration is the estimation of the mapping between a camera image and a flat court or pitch template, also known as field registration or sports field calibration. It converts a player's position in pixels into real court coordinates, which speed, distance and spacing metrics all require.
What is the difference between player tracking and player re-identification?
Tracking links the same player across consecutive frames within a continuous shot. Re-identification reconnects a player after that link breaks, such as after a camera cut, the end of a replay or a long occlusion, by comparing learned appearance features.
Can you measure player speed from broadcast video?
Yes, if the video is registered to the court. Speed comes from how far a player's court position moves between frames, so its accuracy depends on registration quality and on consistently using the foot point. Without registration you are measuring pixels per second, which changes every time the camera zooms.
Why is jersey number recognition so hard in broadcast video?
Numbers are small, often turned away from the camera, blurred by motion or hidden by other players. Research on broadcast football found them unreadable in most frames, so reliable systems combine readings across a whole tracklet instead of trusting any single frame.
Is there a public dataset for basketball player re-identification?
Yes. The DeepSportradar player re-identification challenge provides basketball player crops from 20-frame sequences supplied by Synergy Sports, with 436 identities in its training set. Its repository states no data licence, so treat it as research-only unless you obtain permission.
Registration and identity decide whether tracking data is usable
Detecting players is only the start. For who inside a club consumes this output and what each role needs from it, see what each club role needs from the data. The GSR authors single out calibration, pitch localisation and jersey numbers as their baseline's weak modules, and in production a pipeline also has to survive the wrong court template, identity drift after cuts and numbers read from blurred frames. The benchmarks show both the progress and its limits: on the GSR challenge set the baseline scored 23.36 and the 2024 winner 63.81, both on 30-second clips.
If your model needs registration keypoints, identity-consistent tracks or jersey labels on your own footage, see Train Matricx pricing and the free pilot or review client results in our case studies. We annotate a free pilot clip so you can check identity consistency on your hardest footage before committing to any volume.
Compiled by the Train Matricx annotation team. Figures were checked against each paper, rulebook, court diagram, repository or competition page in September 2026. Spot an error? Email info@trainmatricx.com.

Client results

“Train Matricx didn't just provide labeling — they became an extension of our team. With 6K+ football matches annotated and counting at 98% accuracy, they are our premier data partner.”

Billy Brush
Founder & CEO, Dark Horse AI
Don't take our word for it. Test the labels.
Send us the footage your current vendor gets wrong — the occluded players, the motion blur, the edge cases. We annotate it and return a QA report you can check frame by frame.
- Your hardest clip, annotated in 48 hours
- Full QA report with per-frame accuracy
- No commitment, no contract, no card