Ice hockey moves faster than almost any team sport played on a fixed surface. Players reach speeds above 30 km/h on skates. The puck travels at over 160 km/h on a hard slap shot. Six players per team change on the fly, sometimes mid-possession, without play stopping. And the entire game happens on a reflective ice surface that creates visual conditions no other sport's computer vision systems have to handle.
This guide covers how computer vision works in ice hockey, why the sport's speed and surface create unique annotation challenges, and what training data requirements look like for teams building NHL-grade tracking models.
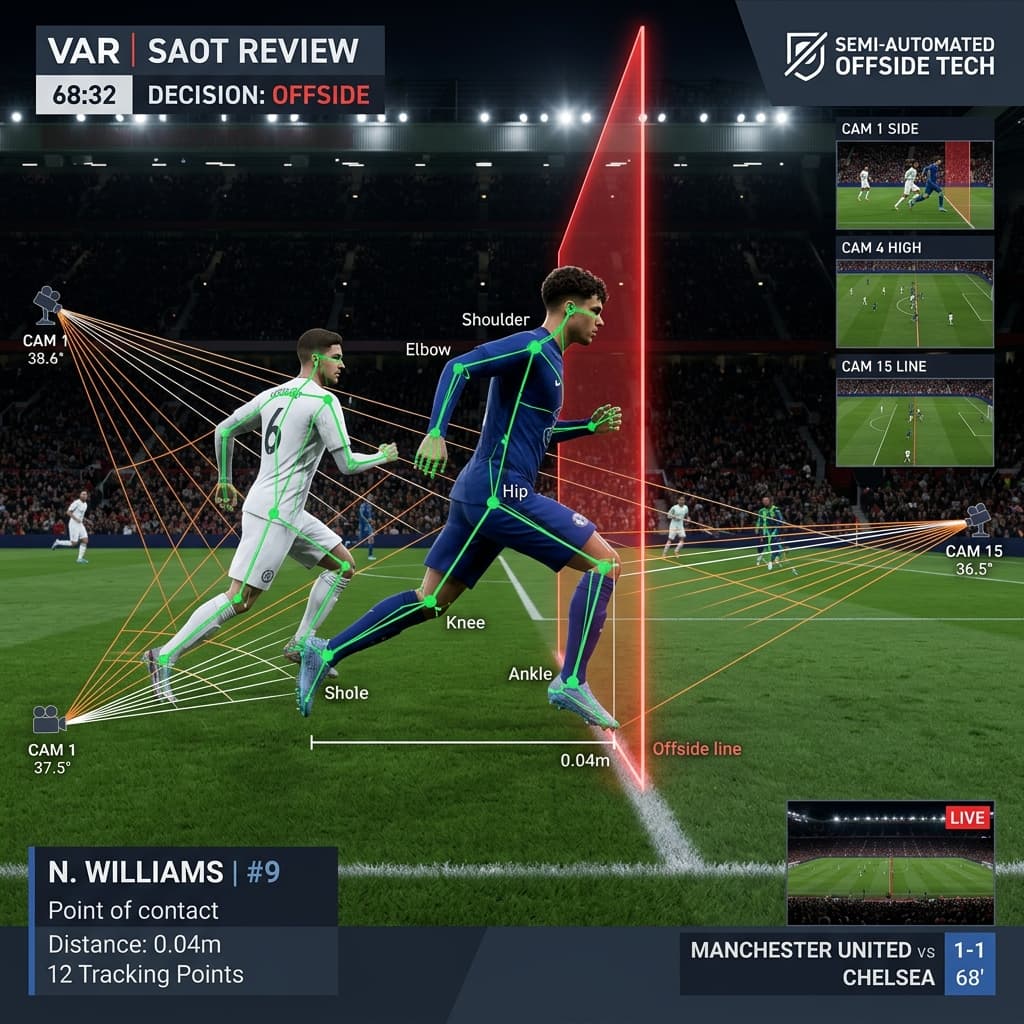
 High-end sports analytics visualization showing ice hockey player tracking, puck speed trajectory lines, and tactical HUD zone overlays.
What is ice hockey computer vision?
Ice hockey computer vision is the use of AI to interpret hockey footage — tracking players and the puck at high speed, detecting line changes, classifying zone entries and exits, recognising plays like power plays and breakaways, and converting game video into structured data for coaching, scouting, broadcast and AI model training.
The technology works from camera footage without sensors on players or equipment. Its output — player positions, puck location, possession data, zone time — feeds into the same downstream products as other sports: coaching dashboards, broadcast graphics and betting data feeds. But the inputs are harder to extract reliably than in almost any other sport.
Why ice hockey is uniquely difficult for computer vision
The puck is smaller and faster than almost any tracked object in team sport. A hockey puck is roughly 7.6 centimetres in diameter — smaller than a tennis ball — and travels faster than a football, basketball or field hockey ball. At slap shot speed, the puck crosses several metres between broadcast frames, making it one of the most difficult objects to track continuously in any sport.
Ice creates reflective glare and inconsistent contrast. Unlike grass, hardwood or clay, ice is a reflective surface. Overhead lighting creates glare patterns that shift depending on camera angle and rink lighting setup. The puck, which is black, can blend into shadow patterns on the ice or disappear in board-side glare — a visual problem unique to hockey among major sports.
Players change on the fly. In most sports, substitutions happen during dead-ball periods. In hockey, line changes frequently happen while the puck is still live — players skate to the bench and new players jump onto the ice mid-possession. A tracking model must handle players entering and leaving the tracked area continuously throughout live play, not just at defined stoppage points.
Board and glass interactions. The puck and players regularly interact with the boards and glass surrounding the rink — pucks ricochet off the boards at sharp, unpredictable angles, and players are checked into the boards as a routine, legal part of the game. This creates rapid directional changes and physical contact sequences that a tracking model must follow without losing identity or trajectory.
Equipment obscures identity. Helmets, face cages or visors, bulky padding and gloves remove most of the visual cues — face, build, hand position — that support player identification in other sports. Jersey number and team colour become the primary, sometimes only, identification signal, and these can be obscured during physical contact along the boards.
High-speed direction changes. Hockey players change direction and speed more rapidly than athletes in most other team sports, due to the low-friction surface. A player can stop, reverse and accelerate within a fraction of a second in a way that is mechanically different from running-based sports, requiring tracking models trained specifically on skating biomechanics rather than running gait patterns.
The five applications of ice hockey computer vision
| Application | What it produces | Primary buyers |
|---|---|---|
| Player tracking | Positions, skating speed, shift length, ice time | NHL clubs, coaching platforms |
| Puck tracking | Trajectory, shot speed, possession, zone location | Broadcast graphics, analytics platforms |
| Zone entry/exit analysis | Controlled vs uncontrolled zone transitions | Coaching, scouting, analytics |
| Event recognition | Shots, passes, hits, faceoffs, penalties | Scouting, performance analytics |
| Line change detection | On-ice personnel groupings and matchups | Coaching, line combination analysis |
Each application requires annotation specific to hockey's structure. Zone entry analysis, for example, has no equivalent in most other sports — it requires labeling the exact frame a player or the puck crosses the blue line, and classifying whether possession was controlled (carried or passed in) or uncontrolled (chipped or shot in without possession).
Puck tracking: the hardest small-object problem in team sport
Puck tracking combines every difficulty that makes small fast-object tracking hard in sports computer vision, with conditions specific to ice hockey on top.
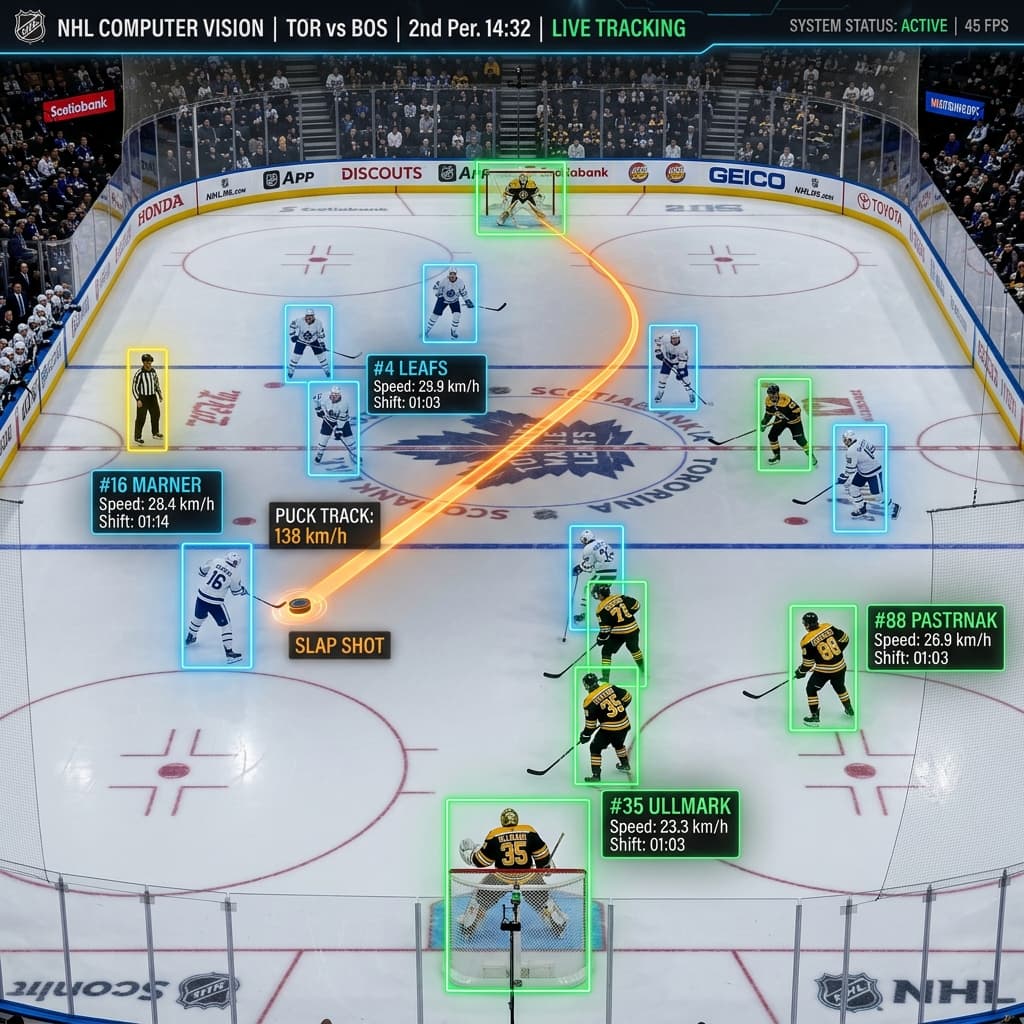
![]() High-speed puck tracking system showing 3D trajectory path, velocity vector, and rotational spin rate analytics.
High-speed puck tracking system showing 3D trajectory path, velocity vector, and rotational spin rate analytics.
Speed and size combined
At a recorded slap shot speed above 160 km/h, a puck travelling toward the net covers more ground per frame than a tennis serve at standard broadcast frame rates, despite being a similarly small object. Combined with the puck's near-black colour against a white ice surface — which paradoxically makes contrast detection easier in clean conditions but much harder during glare or shadow — puck tracking models need extensive training on motion blur frames specific to ice hockey lighting conditions.
Board deflections and bounces
Pucks deflect off the boards at sharp angles dozens of times per period. Unlike a ball bouncing on a flat surface with predictable physics, a puck deflecting off curved boards, off a player's stick, or off the glass produces trajectory changes that are difficult to predict from physics alone. Training data needs extensive examples of board deflection sequences with the deflection frame explicitly labeled, so the model learns the discontinuity rather than trying to fit a smooth trajectory through it.
Occlusion during puck battles
Along the boards, multiple players regularly contest puck possession in tight physical contact — a scenario similar to a football scrum but on skates, in confined space, with sticks adding additional visual clutter. The puck is frequently completely hidden during these sequences, sometimes for one to two seconds of real time. Annotators must label puck position through these occlusions using contextual and physics-based inference, and QA must verify that the inferred position is consistent with the eventual point where the puck becomes visible again.
Player tracking and the line change problem
Identity through equipment
Hockey equipment — helmets with face cages or visors, bulky shoulder and chest padding, gloves — removes most individual visual distinctiveness between players. Two players of similar height and build wearing the same team's equipment can look nearly identical from a broadcast camera. Jersey number becomes the primary identification feature, but numbers are frequently obscured during physical play, particularly when players are checked into the boards or engaged in puck battles.
Training data for hockey player tracking needs to weight jersey number visibility heavily and provide explicit guidance for re-identification when number is not visible — using positional context, skating pattern, and team colour as secondary signals.
On-the-fly substitutions
Most team sports substitute players during defined stoppages. Hockey allows substitutions during live play, with players skating to and from the bench while the puck remains in play. This means a tracking model must continuously detect players entering and exiting the tracked zone throughout live action, distinguishing between a player leaving the play area for a substitution and a player who has simply skated out of camera frame temporarily.
Annotating line changes requires labeling the exact frame each player enters or exits via the bench, which line combination is on the ice at any given moment, and linking these labels to the shift-length and matchup analytics that coaching staff use to evaluate player deployment.
Event recognition in hockey
Hockey's event taxonomy includes shots (with sub-types: slap shot, wrist shot, snap shot, backhand, one-timer), passes, hits, faceoffs (with location and winner), penalties (with type and duration), and zone entries and exits.
Shot classification specifically requires understanding stick mechanics — the difference between a slap shot and a snap shot is in the wind-up and weight transfer, not just shot speed. Annotators need hockey-specific knowledge to label these correctly, particularly for biomechanical models used in player development that analyse shooting technique.
Faceoff analysis requires labeling the exact draw location (one of nine standard faceoff dots), which player won possession, and the immediate tactical sequence that follows — data that feeds directly into special teams and zone-time analytics used by coaching staff.
What ice hockey training data requires
For player tracking:
- Bounding boxes per player per frame with jersey number annotation prioritised
- Persistent IDs through board contact, checks and puck battles
- Bench entry and exit frame labels for line change tracking
- Team and position labels
For puck tracking:
- Frame-by-frame puck position including occluded frames during puck battles
- Board deflection frame labels with trajectory discontinuity marked
- Shot release and contact frame labels
- Zone location relative to blue lines and goal lines
For event recognition:
- Shot type classification with release mechanics context
- Faceoff location, participants and outcome
- Zone entry/exit classification (controlled vs uncontrolled)
- Penalty type, duration and players involved
Frequently asked questions
What is ice hockey computer vision? Ice hockey computer vision uses AI to interpret hockey footage — tracking players and the puck at high speed, detecting zone entries and exits, recognising events like shots and faceoffs, and producing structured data for coaching, scouting, broadcast and AI training. It works from camera footage without requiring sensors on players or equipment.
Why is puck tracking harder than ball tracking in other sports? The puck is smaller than most tracked sports objects, travels at speeds exceeding 160 km/h on shots, is dark-coloured against a reflective ice surface that creates inconsistent contrast, and frequently deflects unpredictably off the boards. It is also regularly hidden during puck battles along the boards, requiring models to infer position through extended occlusion using physics and context rather than direct detection.
What is zone entry analysis in hockey AI? Zone entry analysis tracks whether a team enters the offensive zone with control of the puck (carried or passed in) or without control (chipped or shot in and recovered). This data is used to evaluate offensive efficiency and is one of the most commonly cited advanced statistics in modern hockey analytics. Training data for this requires frame-accurate labeling of the moment a player or puck crosses the blue line, with possession status classified at that exact frame.
How does the NHL use computer vision and tracking technology? The NHL has deployed player and puck tracking technology using sensors embedded in pucks and player equipment for certain broadcast and analytics applications, alongside computer vision systems that extract tactical data from video footage — including zone time, shot location, and line combination data that sensor systems alone do not classify.
What makes hockey annotation different from other team sports? Hockey requires annotators to understand skating biomechanics rather than running gait, must account for on-the-fly substitutions that have no equivalent in stoppage-based sports, and needs specific handling for ice surface visual conditions including glare and puck-on-ice contrast. The on-the-fly line change problem in particular has no direct equivalent in football, basketball or cricket.
What training data does an NHL-grade tracking model need? A production hockey tracking model needs player bounding boxes with persistent IDs through board contact and checks, puck position labels including occluded frames during puck battles, board deflection sequences with discontinuity points marked, and event labels for shots, passes, hits and faceoffs annotated by people who understand hockey terminology and mechanics.
The takeaway
Ice hockey combines the fastest tracked object in mainstream team sport, a uniquely difficult playing surface, and a substitution pattern that has no equivalent anywhere else in professional sport. Building reliable computer vision for hockey requires training data that explicitly represents board deflections, puck battle occlusion, and on-the-fly line changes — scenarios that generic sports annotation does not anticipate.
If you are building ice hockey computer vision models and need expert-annotated training data — player tracking, puck trajectory, zone analysis or event classification — see how Train Matricx works or review annotated dataset results in our case studies. We annotate a free pilot clip so you can evaluate quality before committing to any volume.
Written by
Train Matricx Team